
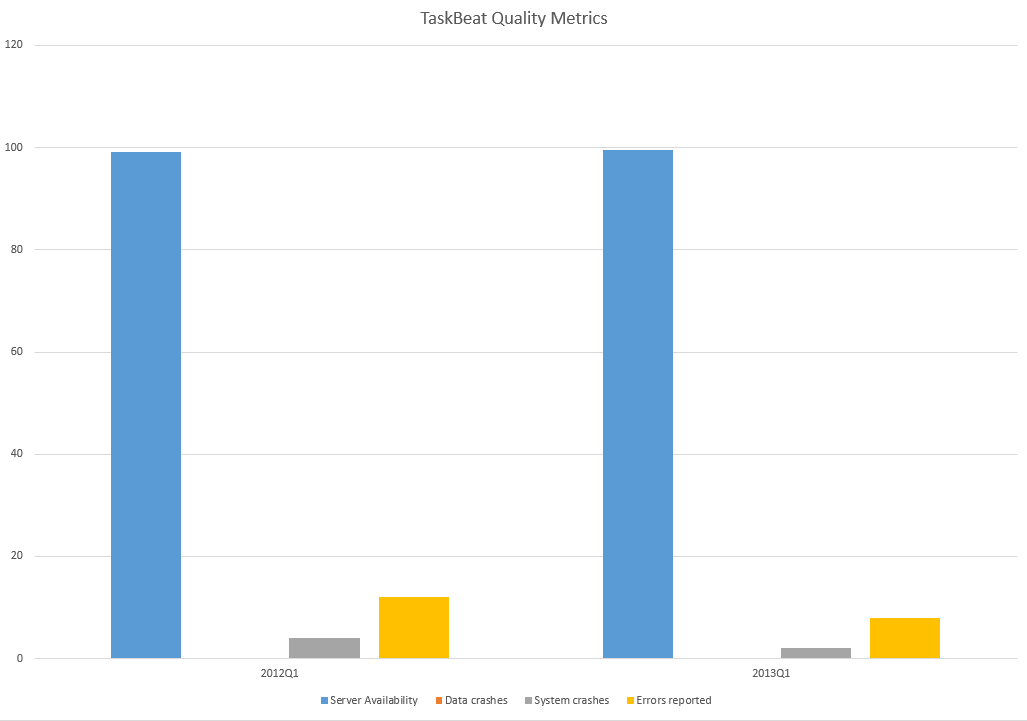
TaskBeat Quality improvements between 2012Q1 and 2013Q1 show a significant improvement in four categories which we use to measure quality of the product: System Availability, Data Crashes, System Crashes, Errors Reported.
System Availability: is up from 99.1% to 99.5%
Data Crashes: no change from 0 incidents to 0 incidents
System Crashes: down from 4 incidents to 2 incidents
Errors Reported: down from 36 to 23 incidents
System Availability – measures system uptime in time with target set on 99%. This metric describes the percentage the system was available for our customers outside the regular Sunday maintenance hours. We aim making the system available 24/7 for at least 99 per cent of time. The improvement from 99.1% to 99.5% doesn’t seem much but this actually is a great overshot over the target. This is measured by statistics from Pingdom.
Data Crashes – measures data consistency for our customers. This metric describes how many times we had to correct the data for our customers due to a system or application fault. This is very important to keep the number as low as possible and we have achieved a solid zero incidents meaning that no of our customers experienced data corruption over the period of three months year on year, second year in a row.
System Crashes – measures number of incidents where system had to restart itself due to a crirical failure of the application or the database server or any other reason. Those self-rectifying issues are of less severity as they don’t indicate direct issues with application and more with a platform as a whole, pointing to possible memory corruptions in long-running operations
Error Reports – measures number of reported application issues where a bug caused an operation to fail and has been reported back for investigation. This metric is one of the most important code quality metrics we gather as error reports may lead to more severe issues: including data crashes, eventually causing system crashes and degrading overall experience of the application.
We rank those four categories in order of severity whereas system availability and data consistency are the number one priorities across functionality of the complete system and also drive both architecture and technology. Most importantly any increase of issues may consume development resources diverted to fixing issues instead of developing new features causing delays on our internal project schedule.
Other interesting points are the stability of the system, as measured by the number of restarts and degradation of available system memory. This seems very stable at circa 75% free system memory with no degradation over one week peroid. The metric is not measured outside one week window due to planned system updates during maintenance hours.